Conversion Rate Optimization: A Practical Guide to More Profitable Growth
Conversion rate optimization is the disciplined process of improving the percentage of qualified visitors who complete a valuable action, such as purchasing, submitting a lead form, booking a consultation, or starting a trial. It is not a collection of button-color tricks. It connects customer intent, page experience, offer structure, measurement, experimentation, and commercial outcomes so that more of the demand you already attract becomes revenue.
For an ecommerce operator, that may mean helping a shopper understand a product quickly enough to add it to cart. For a marketing leader, it may mean increasing qualified demo requests without sending sales an unmanageable volume of weak leads. For a paid media team, it means making landing-page changes that improve incremental profit, not merely the reported conversion rate. The central question is: what prevents a high-intent visitor from taking the next valuable step?
What Conversion Rate Optimization actually includes
A conversion rate is a ratio: completed conversions divided by the relevant set of visitors, sessions, or clicks. The denominator matters. A product page viewed by paid search visitors should not automatically be judged against a homepage visited by returning customers, and a lead form submitted by existing customers should not be treated as equivalent to a sales-qualified opportunity.
Conversion rate optimization is a decision system for improving that ratio while protecting the quality and economics of the outcome. It usually includes four connected activities:
- Measurement: defining the conversion event, its value, its source, and the population being evaluated.
- Diagnosis: identifying friction, uncertainty, mismatch, or technical failure in the path to conversion.
- Intervention: changing the message, offer, interface, flow, audience experience, or traffic destination.
- Learning: comparing outcomes with a credible method and deciding whether to adopt, revise, or reject the change.
The word “valuable” is doing important work. A completed form is not necessarily a good conversion if it produces duplicate records, unqualified inquiries, or contacts outside the company’s service area. Likewise, an order is not automatically profitable if discounts, shipping costs, returns, and media costs consume the contribution margin.
A useful measurement model separates three layers:
| Layer | Question | Example outcome |
|---|---|---|
| Behavior | Did the visitor take the next step? | Product view to add-to-cart rate |
| Business | Did the action create economic value? | Gross profit after discount and fulfillment |
| Customer | Did the acquisition create durable value? | Repeat purchase or retained subscription |
For paid acquisition, this distinction prevents a common error: optimizing the landing page for a cheap action while ignoring what happens after that action. Google Ads describes conversion tracking as a way to measure actions after an ad interaction, including purchases, sign-ups, and calls; its setup documentation is a useful reference for aligning tracked actions with business goals (Google Ads conversion tracking documentation).
Conversion optimization also differs from general website redesign. A redesign may improve architecture, visual identity, or maintainability. Optimization asks a narrower question: which change is most likely to improve a defined outcome for a defined audience? A redesign can contain optimization work, but attractive pages are not evidence of better commercial performance.
Why it matters for acquisition economics
Acquisition efficiency is constrained by more than media buying. If a campaign sends qualified traffic to a page with unclear positioning, slow interaction, weak proof, or an unnecessarily difficult checkout, the media team pays to expose a problem. Improving the post-click experience can therefore change the economics of an existing channel without increasing reach.
Consider an illustrative example, not a universal benchmark. Suppose an ecommerce store receives 20,000 relevant sessions in a month, has a 2% purchase rate, and earns $70 in contribution margin per order. That produces 400 orders and $28,000 in contribution margin before acquisition costs. If a credible improvement raises the purchase rate to 2.4% while traffic quality and margin remain stable, the same traffic produces 480 orders and $33,600 in contribution margin. The commercial value is not “a higher percentage” in isolation; it is 80 additional orders from the same traffic opportunity.
The example becomes less attractive if the change also increases returns, attracts low-margin orders, or depends on a discount that reduces contribution margin. That is why practitioners track profit-adjusted conversion value, not only the top-line event.
The relationship between conversion rate and paid media
For a simple paid campaign, the mechanics can be expressed as:
- Impressions create clicks.
- Clicks create sessions or visits.
- Visits create product views, form starts, or other intent signals.
- Those actions create purchases, qualified leads, or booked revenue.
- Revenue and margin determine whether the acquisition cost is acceptable.
An illustrative paid-search scenario shows why the sequence matters. A campaign buys 1,000 clicks at an illustrative $2.50 cost per click, so media spend is $2,500. At a 3% lead conversion rate, it creates 30 leads, or an illustrative $83.33 cost per lead. If a page change produces a 4% lead rate, it creates 40 leads at the same spend, reducing cost per lead to $62.50. But if the qualification rate falls from 40% to 20%, qualified leads decline from 12 to 8. The apparent conversion improvement is commercially worse.
Conversion quality must travel through the funnel. For lead generation, connect the form submission to qualification, opportunity creation, and eventual revenue where data governance permits. For ecommerce, connect the purchase event to net sales, margin, refunds, and repeat behavior. If those links cannot yet be made, state the limitation clearly and use the strongest available proxy rather than pretending the proxy is revenue.
There is also a strategic reason to optimize before scaling spend. More traffic can hide a weak experience temporarily because volume increases the number of successes. It does not repair the underlying mismatch. Before expanding a channel, inspect:
- Whether the landing page reflects the ad’s promise and audience.
- Whether the primary action is understandable without insider knowledge.
- Whether mobile users can complete the core task without avoidable effort.
- Whether the offer is competitive for the segment being targeted.
- Whether conversion tracking distinguishes new customers, existing customers, and low-value actions.
Paid media and onsite optimization should therefore share a brief. The ad creates an expectation; the page must confirm it. The audience strategy determines what objections are likely; the page should answer those objections. The business model determines what counts as value; the measurement plan should reflect it. This is where broader digital marketing services need to operate as one system rather than separate channel tasks.
How a reliable optimization program works
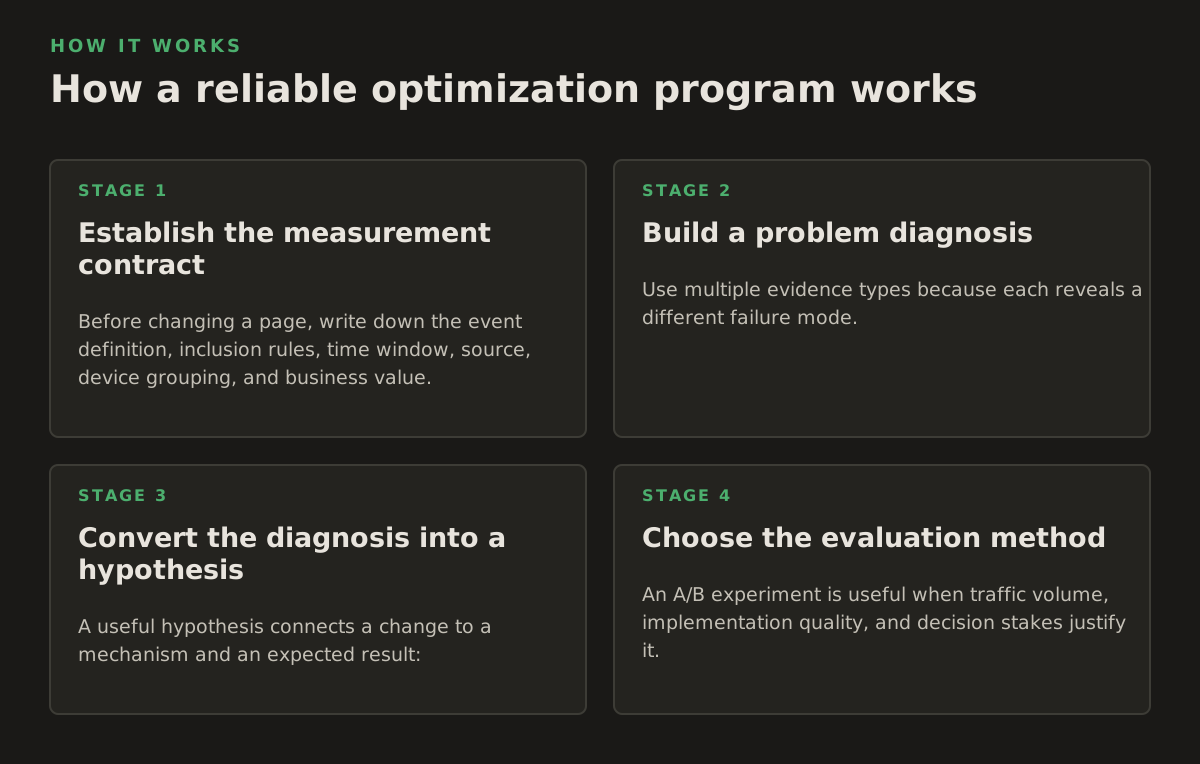
A reliable program starts with a prioritized problem, not a backlog of visual ideas. “Test a new hero image” is an implementation request. “Visitors from non-brand paid search do not understand which operational problem the product solves before reaching the pricing section” is a testable diagnosis.
1. Establish the measurement contract
Before changing a page, write down the event definition, inclusion rules, time window, source, device grouping, and business value. Decide whether the analysis uses users, sessions, clicks, orders, or qualified leads. Confirm that redirects, payment steps, consent settings, and cross-domain behavior do not remove or duplicate the event.
As of 2026, Google Analytics documentation distinguishes important user actions as “key events,” while Google Ads uses conversion actions for advertising measurement. The systems can work together, but their purposes and configurations should not be assumed to be identical; the official explanation of key events is available in Google Analytics’ key events documentation.
A measurement contract should answer:
- What is the primary success event?
- Which secondary events explain progress or friction?
- What traffic is included or excluded?
- What event indicates quality after the initial conversion?
- Which source is authoritative when platforms disagree?
- What known tracking gaps could change the decision?
2. Build a problem diagnosis
Use multiple evidence types because each reveals a different failure mode. Quantitative data shows where behavior changes. Session recordings or usability observation can show what people struggle to understand. Customer-support transcripts reveal recurring objections. Sales notes expose qualification problems. Search-query and ad data reveal the language visitors expected to see.
A practical diagnosis usually falls into one of five categories:
- Message mismatch: the page does not continue the promise or language that earned the click.
- Value uncertainty: visitors cannot tell why the offer is worth the money, effort, or risk.
- Trust friction: proof, policies, guarantees, delivery details, or business credibility are missing or hard to find.
- Interaction friction: the form, navigation, checkout, or mobile interface creates unnecessary work.
- Technical friction: errors, slow loading, broken events, failed payments, or layout shifts interrupt the task.
Do not infer a cause from a metric alone. A high exit rate may indicate weak intent, a poor page, a missing product attribute, a tracking defect, or a normal stopping point. A low form completion rate may be caused by too many fields, but it may also reflect an offer that does not justify contact.
3. Convert the diagnosis into a hypothesis
A useful hypothesis connects a change to a mechanism and an expected result:
For first-time visitors arriving from category-level paid search, clarifying the product’s fit, delivery expectation, and primary benefit above the first major scroll should increase completed purchases because it reduces uncertainty before product comparison.
The hypothesis identifies an audience, a change, a mechanism, and an outcome. It can be falsified. “Make the page feel more premium” cannot.
4. Choose the evaluation method
An A/B experiment is useful when traffic volume, implementation quality, and decision stakes justify it. A controlled test reduces the risk of mistaking normal fluctuation for a real effect, but it does not automatically solve poor tracking, audience contamination, novelty effects, or multiple competing changes. Google Ads’ official experiments documentation explains the role of experiments and control groups in comparing campaign changes (Google Ads experiments guidance).
When a formal test is not practical, use a structured before-and-after analysis with explicit controls. Record the change date, compare equivalent traffic segments, inspect tracking stability, and look for changes in downstream quality. This is weaker evidence than a well-run randomized experiment, so the decision should be proportionate: adopt cautiously, continue monitoring, or seek more evidence.
Testing is not limited to two page designs. Depending on the question, practitioners may use:
- Controlled A/B tests for a focused page or flow change.
- Sequential analysis for a staged learning plan where traffic is limited.
- Holdout groups for lifecycle or promotional interventions.
- Usability sessions for comprehension and task-friction questions.
- Funnel and cohort analysis for downstream value and retention.
5. Interpret the result in context
Evaluate the primary metric first, then inspect guardrails. For an ecommerce test, guardrails might include average order value, refund rate, margin, payment failures, and new-customer share. For lead generation, they might include lead acceptance, sales-contact rate, opportunity rate, and duplicate submissions.
Illustrative example: A change that increases form submissions by 15% but reduces accepted leads by 10% is not an obvious win. A change that produces no immediate lift but reduces support contacts or improves qualified-pipeline creation may still be valuable. Decision quality depends on the metric hierarchy, not on finding a positive number somewhere in the report.
Where optimization programs break
Most failures are not caused by a lack of ideas. They come from confusing a visible symptom with a cause, measuring the wrong event, or applying a valid tactic in the wrong context.
Optimizing the wrong denominator
A blended conversion rate can conceal meaningful differences. Brand-search visitors, remarketing visitors, new category visitors, mobile users, and customers returning for a reorder have different intent. If a high-intent segment grows, the overall rate can improve even while a new acquisition segment deteriorates.
Segment for a reason, not because every available dimension looks interesting. Useful cuts often include:
- New versus returning visitors.
- Brand versus non-brand acquisition.
- Device type and meaningful screen-width groups.
- Landing page and offer type.
- Customer geography or service eligibility.
- First purchase versus repeat purchase.
Do not create so many segments that every result becomes underpowered or ambiguous. Start with the business question and the most plausible source of heterogeneity.
Confusing correlation with causation
Visitors who use a product comparison tool may convert at a higher rate, but that does not prove the tool caused the conversion. More motivated shoppers may simply be more likely to use it. Similarly, a new campaign and a new landing page launched together cannot reliably tell you which change drove the outcome.
Keep major variables separable when possible. If separation is impossible, document the confounding factors and avoid overclaiming. A directional signal can inform the next test, but it should not be presented as causal proof.
Using speed as a slogan instead of a diagnosis
Performance affects whether visitors can interact with a page, but “make it faster” is not a complete optimization brief. Identify the asset, device condition, interaction, and business consequence. Google’s web performance guidance describes Core Web Vitals as metrics related to loading performance, responsiveness, and visual stability; the current reference is available at web.dev’s Web Vitals documentation.
A page may have acceptable lab scores and still confuse visitors with poor product information. Conversely, an image may be commercially important enough to justify its cost if compressing it removes essential product detail. Technical performance is a conversion input, not a substitute for relevance.
Overusing discounts
Discounts can reduce price resistance, but they can also train customers to wait, lower margin, and obscure whether the product proposition is strong. If a promotion is tested, measure incremental purchases, margin, new-customer quality, and post-purchase behavior. Compare it with non-price interventions such as clearer delivery information, better bundling, financing explanation where applicable, or stronger product proof.
Ignoring implementation risk
A winning variant that breaks analytics, accessibility, subscription logic, inventory messaging, or checkout behavior is not a successful optimization. Before release, define acceptance checks for:
- Event firing and attribution.
- Form validation and error handling.
- Payment, cart, and promo-code behavior.
- Mobile and keyboard interaction.
- Privacy-consent behavior where relevant.
- Page speed and layout stability.
Optimization compounds only when successful changes are documented, implemented safely, and monitored after the experiment ends.
How practitioners apply it across the customer journey
The best intervention depends on the stage of intent. A visitor who does not understand the category needs a different experience from a returning customer who is blocked by shipping uncertainty. Treating every page as a generic conversion surface leads to generic recommendations.
Acquisition landing pages
Match the page to the promise that generated the visit. If an ad emphasizes a specific use case, the first screen should confirm that use case rather than forcing the visitor to interpret a broad corporate message. Show the audience, problem, outcome, and next step in a sequence that supports the decision.
For paid traffic, evaluate both immediate and delayed actions. A landing page can increase the rate of low-intent form starts while decreasing completed appointments. It can also reduce bounce behavior but fail to improve revenue. Use the page’s role in the funnel to select the primary metric.
Useful changes may include:
- Replacing internal product language with the customer’s search or problem language.
- Making eligibility, location, delivery, or availability visible earlier.
- Adding proof adjacent to the claim it supports rather than isolating proof in a distant section.
- Reducing competing calls to action when one action is commercially primary.
- Creating distinct pages for materially different audiences or use cases.
Product and category pages
Product pages must answer the questions that prevent commitment: Is this appropriate for my situation? What exactly arrives? Why is it different? What will it cost in total? When can I receive it? What happens if it does not work for me?
Category pages have a different job. They help shoppers narrow the set of relevant options. Filters, comparison information, inventory clarity, and useful sorting can matter more than adding another promotional banner. Measure progression from category view to product view and then to cart, while checking whether the change merely pushes friction to a later step.
Checkout and lead forms
Every field is a request for effort and a potential reason to defer. Remove fields that do not affect fulfillment, qualification, routing, or compliance. If a field is necessary, explain why when the reason is not obvious. Show costs and requirements before the final commitment rather than introducing surprises at the end.
For lead generation, form length is only one variable. The promise surrounding the form determines whether completion feels worthwhile. A short form attached to a vague offer may underperform a longer form attached to a specific, credible next step. Evaluate qualified conversion rate, not just completion rate.
Measurement and reporting
A reporting view should help a marketing leader decide what to do next. It should not simply display every available platform metric. A practical weekly or monthly view may include:
- Traffic and spend by meaningful acquisition segment.
- Primary conversion rate with denominator defined.
- Cost per primary conversion and cost per qualified outcome.
- Revenue or contribution value where available.
- Key funnel drop-offs and technical error indicators.
- Active experiments, decision dates, and implementation status.
Use confidence language that matches the evidence. “The result is directionally positive in the observed period” is more credible than declaring a permanent win after a short, noisy comparison. Also record what was not measured. Missing repeat-purchase data or inconsistent offline lead imports may limit the conclusion, and that limitation should influence budget decisions.
Brand and creative alignment
Conversion optimization should not flatten a brand into a sequence of urgency messages. Brand strategy affects what people expect, trust, remember, and are willing to pay for. Creative strategy affects whether the promise is understood quickly enough to earn attention. The optimization question is not “brand or performance?” but “which expression of the brand helps this audience make a confident decision?”
That requires alignment between acquisition creative and destination experience. If an ad uses a strong customer problem, the page should develop that problem with proof and a credible solution. If the brand makes a premium claim, the checkout, service details, and post-purchase experience must support it. A polished campaign that leads to a generic page creates avoidable expectation debt.
For teams building a repeatable program, prioritize work by expected value and feasibility rather than by stakeholder volume. A useful starting policy for 2026 might rank each opportunity on illustrative one-to-five scores for affected traffic, commercial impact, evidence strength, implementation effort, and risk. Those scores are a planning device, not a universal formula.
- High evidence, high impact, low risk: address promptly and measure the downstream outcome.
- High impact, weak evidence: run research or a focused test before a major build.
- Low impact, low effort: bundle with planned releases rather than treating it as a strategic initiative.
- High risk or unclear measurement: repair tracking and define guardrails first.
- Strong short-term lift with margin risk: analyze customer quality before scaling.
The most durable capability is not a larger experiment backlog. It is a shared operating model in which brand, creative, media, analytics, product, and revenue teams agree on the customer problem and the value of solving it. Kimmel Marketing can support that connected approach through its marketing expertise, bringing strategy, creative development, media buying, and performance optimization into a clearer growth plan. If your acquisition program needs that level of alignment, explore Kimmel Marketing for a practical assessment of the highest-value conversion opportunities.
Authored with NotFair SEO